01 / Operating System
Preplane
I designed and built, end to end, the internal platform that replaced fragmented spreadsheet based tracking for career preparation and placement readiness, by modeling the entire operation as connected data and then designing the interface and automation around it.
- Masters' Union
- Education and Career Readiness
- About three months to build
- Product thinking, systems and data modeling, interface design, and full build
Outcome
- 1A single connected operating layerPreparation, mentoring, interviews, and outcomes now live inside one data model instead of a collection of independent trackers that each held a different piece of the same student's journey.
- 40%Faster turnaround across the placement pipelineI drove the work to take status updates, reminders, and reconciliation off people's memory and into the system. The average time to move a process from one stage to the next came down by around 40%, and the team runs on it every day.
- Down from
1–2 hrs1–2 minHours of manual lookup collapsed into minutesA question that used to mean opening and cross referencing several spreadsheets and trackers, often an hour or two of a POC's time, is now answered by opening one view or asking the copilot, typically in one to two minutes.
Context
The operation had data, but it never had a system.
The Career Prep team was responsible for an unusually wide range of work. Domain preparation across nine functional tracks, behavioral preparation, mentor coordination, classes, practicums, mock interviews, last mile preparation, interview tracking, placement tracking, POC ownership, assignment and score tracking, transcripts, checklists, and reporting were all running at once. Each of these activities could be handled individually. What could not be done easily was seeing them together.
The real problem was never that there were too many spreadsheets. The real problem was that none of these sources shared a common key. A student's preparation record lived in one place, their mentor assignment in another, their interview status somewhere else again, and their eventual outcome in a fourth location. Answering a simple question, such as where a particular student currently stood in the placement journey, meant manually cross referencing several sources every single time someone needed the answer.
This created a specific kind of organizational blindness. The team could execute individual tasks well, but understanding the system as a whole, identifying where students were dropping off, which interview stage was creating friction, which POC was carrying too much load, or which preparation steps were actually complete, required assembling information by hand, under time pressure, again and again.
- Sheets, documents and mentor threads
- Manual reconciliation
- Limited visibility across the system as a whole
Solution
One system to run the workflow, one data layer to understand it.
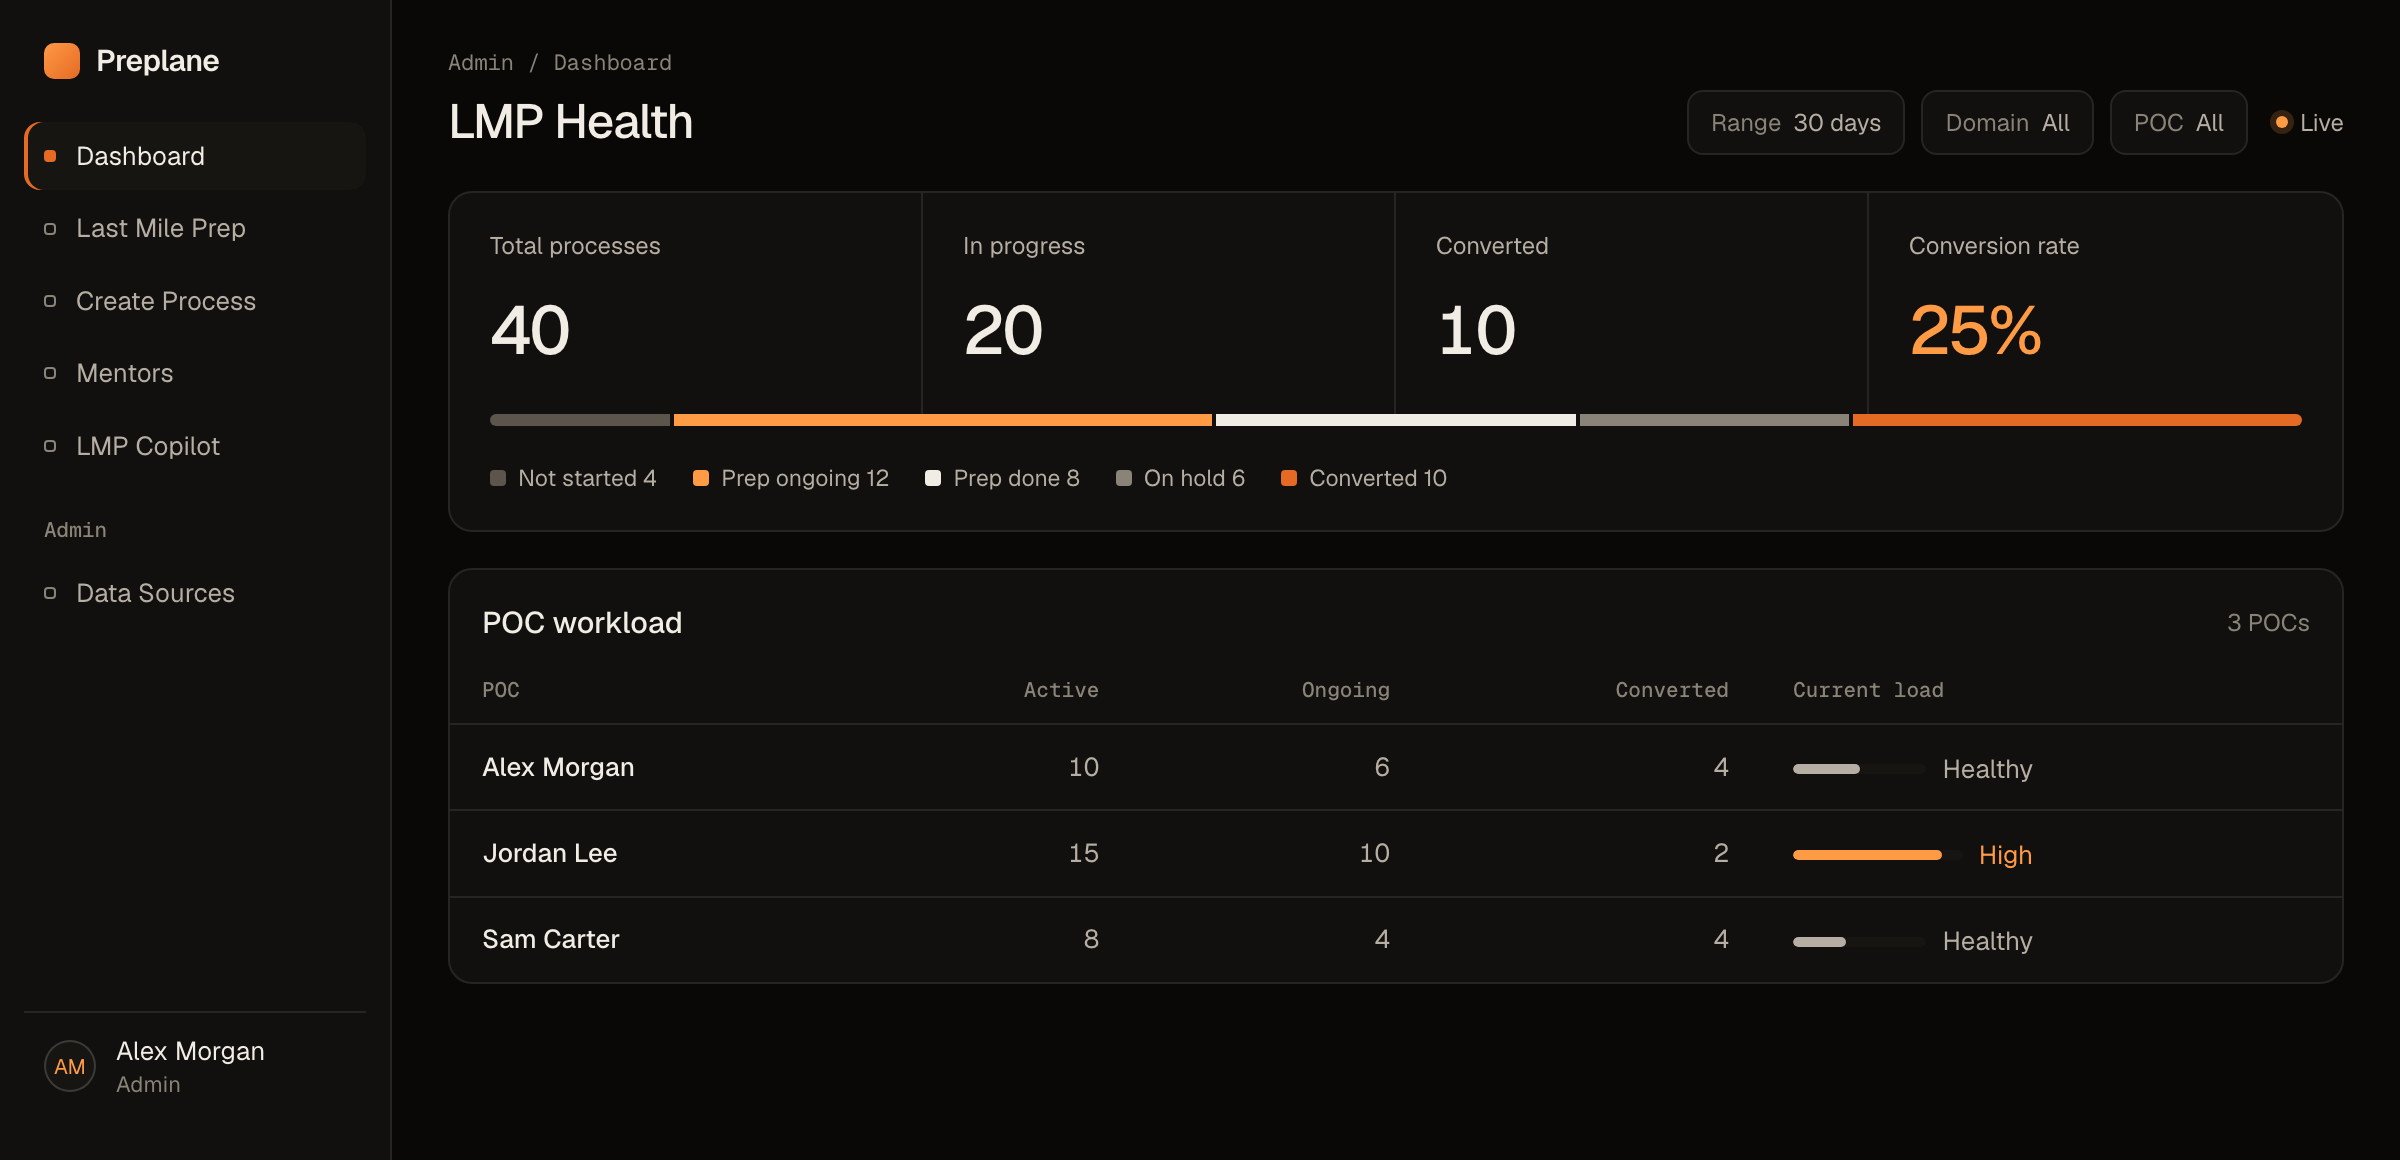
Preplane was not built as a dashboard sitting on top of the existing operation. It was built as the operation itself, restructured. It carries two roles at once, both running on the same underlying data. There is an operational layer, which is what the Career Prep team uses to actually do the work, creating placement processes, logging preparation updates, aligning mentors, and tracking interviews. And there is an intelligence layer, which turns those same everyday actions into pipeline health, workload distribution, conversion rates, and drop off points, without anyone needing to assemble a separate report.
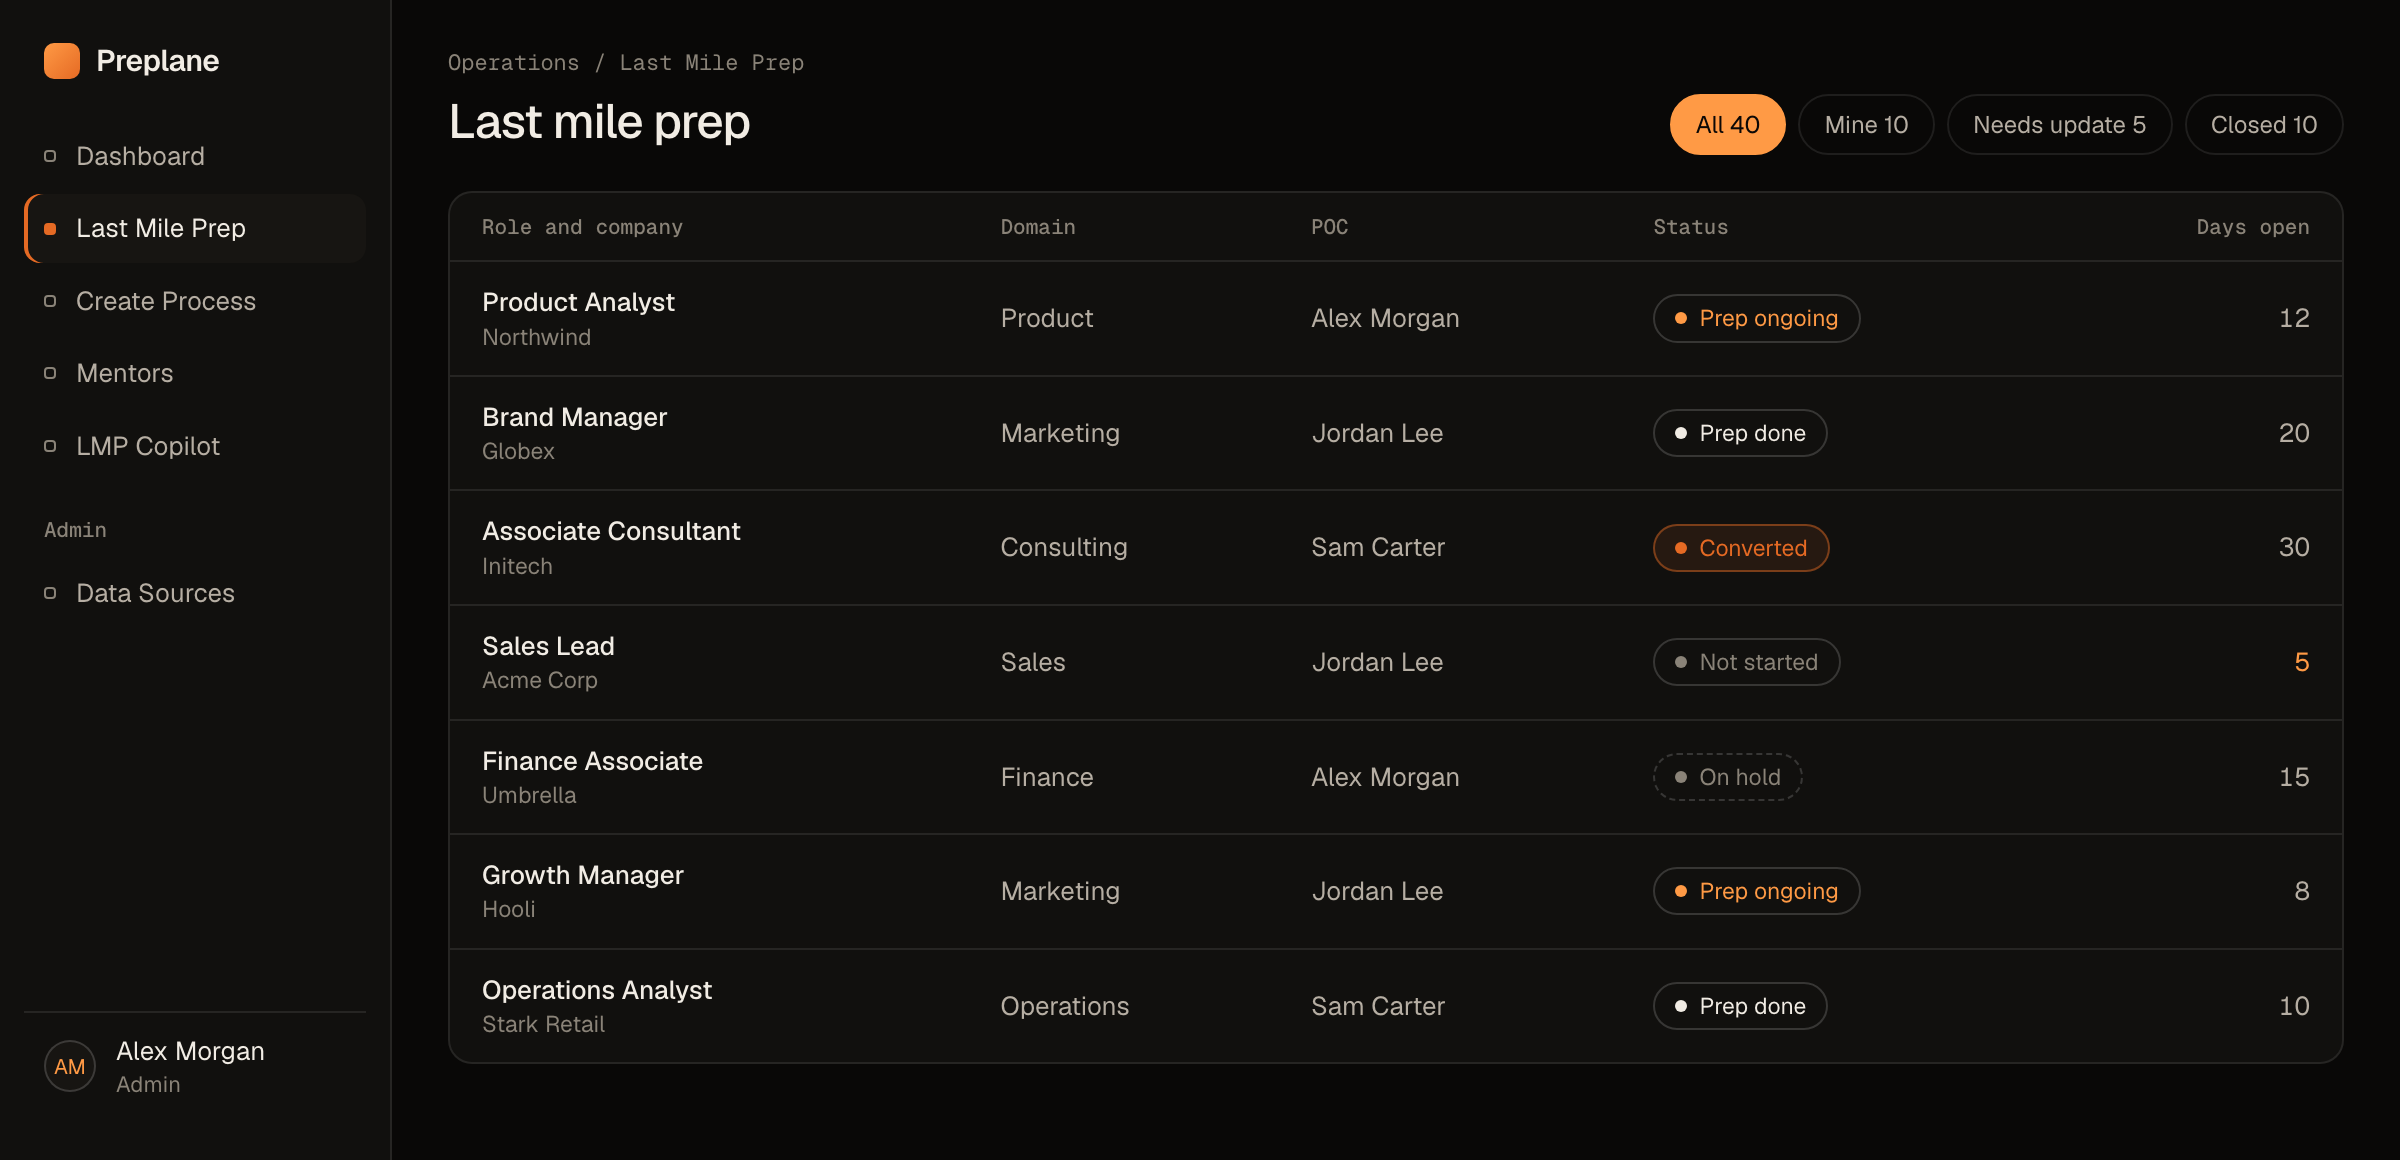
The core unit inside the system is called an LMP process, short for last mile placement process. It represents a single role at a single company, moving through preparation. Every process carries the same underlying structure: one or two owning POCs, a domain, a candidate pipeline, an aligned mentor, an execution checklist covering things like mentor alignment, the preparation document, the assignment round, and a completed mock interview, a daily progress log, and, once the process reaches interviews, transcripts and final outcomes. Because every process follows this same structure, the same interface works whether someone is looking at a single process or the entire portfolio at once.
- Learning
- Preparation
- Practice
- Evaluation
- Interview
- Feedback
- Last mile preparation
- Placement
A data model built around the entities the operation actually runs on.
The frontend is built in React and TypeScript, deployed on Cloudflare Pages. Underneath it sits Supabase, providing Postgres, authentication, row level security, and realtime updates. Rather than representing everything inside one wide spreadsheet standing in for many different concepts, the schema gives each real entity its own table, students, placement processes, candidates, POC ownership links, mentors, checklists, daily logs, and interview transcripts among them. Numbers that need to be calculated, such as a POC's current workload, a domain's conversion rate, or a student's total candidate count, are computed once inside Postgres functions, so every screen that shows that number, whether it is the dashboard, a single process card, or a student's profile, is always reading the same underlying value.
- LMP Copilot: a retrieval backed assistant built on OpenAI, with OpenRouter and Grok available as fallbacks, that can answer questions about students, POCs, mentors, and service level status directly from the system's own data, and can also help draft an update rather than someone writing one entirely from scratch.
- JD and resume parsing: job descriptions and resumes are automatically turned into structured, preparation ready data. This was built with a strict rule that it only reports what is verbatim present in the source document. It does not infer or invent skills or experience that are not actually there.
Turning repetitive coordination into workflows.
- Two way sheet synchronization: the team's existing tracker sheets were not replaced, they were kept, and turned into a synchronized view rather than the single source of truth. A status change made inside the platform propagates into the linked sheet, and a change made in the sheet propagates back. When a process moves into a terminal status, its closing date is stamped automatically instead of being typed in by hand. Anything that fails to sync midway is queued for a retry instead of silently drifting out of agreement.
- A scheduled progress reminder job: a scheduled function checks every active process against the date its next update is expected, and emails the owning POC a reminder, or an overdue notice if that date has already passed, with a direct link back into that specific process. It behaves like a diligent manager following up, except it runs on a schedule instead of relying on someone's memory.
- Placement data synchronization: student placement status is read directly from the cohort workbooks the team already maintains. The sync function normalizes inconsistent headers and values across different sheets, such as roll number, email, placement status, program, and cohort, and reconciles the result against the canonical student record, flagging anything ambiguous for review rather than guessing at an answer.
Designed for operational density.
The people using Preplane are managing dozens of active processes at the same time. The interface has to let them see exceptions, ownership, and status before it asks them to click into anything. The screens below are recreated with fictional demo data in place of production data.
Next project
 Credstack →